Des graphiques
dans Symfony
avec Twig et SVG
Scalable
Vector
Graphics
Une image
XML
<svg xmlns="http://www.w3.org/2000/svg">
</svg>
2D
Vectorielle
Formes = Noeuds XML
<circle cx="55" cy="40" r="32"><rect
x="10"
y="25"
width="60"
height="60"
fill="red"
/><line
x1="89"
y1="15"
x2="35"
y2="76"
stroke="brown"
stroke-width="2"
/><path
d="M 5 40 C 20 5 32.5 5, 47.5 40 S 75 75, 90 40"
stroke="orange"
stroke-width="2"
fill="none"
/>Parfait pour les graphs !
SVG + Twig = <3
SVG dans vos template :
dashboard.html.twig
{% block body %}
<div>
  <svg viewBox="0 0 200 20" xmlns="http://www.w3.org/2000/svg">
    {% for value in data %}
      <rect x="{{ loop.index }}" y="0" width="5" height="{{ value }}" />
    {% endfor %}
  </svg>
</div>
{% endblock %}
pie.svg.twig
<svg viewBox="0 0 200 200" xmlns="http://www.w3.org/2000/svg">
    {# ... #}
</svg>
pie.html.twig
{% include 'graph/pie.svg.twig' with { data: user.activity } %}
Toute la puissance de Twig
- Variables
- Boucles, conditions, macros, ...
- Traduction
Réponse au format SVG :
/**
 * @Route("/pie.svg", name="pie", defaults={"_format":"svg"})
 */
public function pie()
{
    return $this->render(
        'graph/pie.svg.twig',
        [ 'fruits' => $this->data->getFruits() ]
    );
}
config/packages/framework.yaml
framework:
    request:
        formats:
            svg: 'image/svg+xml'
<img src="{{ path('pie') }}" />background-image: url(/pie.svg);Une réponse HTTP complète !
    [
      'fruit.apricot' => 0.38,
      'fruit.melon' => 0.18,
      'fruit.peach' => 0.065,
      'fruit.fig' => 0.14,
      'fruit.plum' => 0.235,
    ]
Stylable en CSS
.warm
.cold
<svg xmlns="http://www.w3.org/2000/svg">
    <style type="text/css">
        svg.pie .portion {
            fill: #FFCDB2;
            stroke-width: 0;
        }
    </style>
    {# ... #}
</svg>
app.css
svg.histogram text {
  font-family: 'Ubuntu', monospace;
}
:hover
Feuille de style print
@media print {
    svg .label {
        opacity: 1;
    }
}
Avantages et contraintes
Léger
Mise en cache
Interactif
Sur mesure
Haute définition
Low tech
Ils l'utilisent :
Github contributions

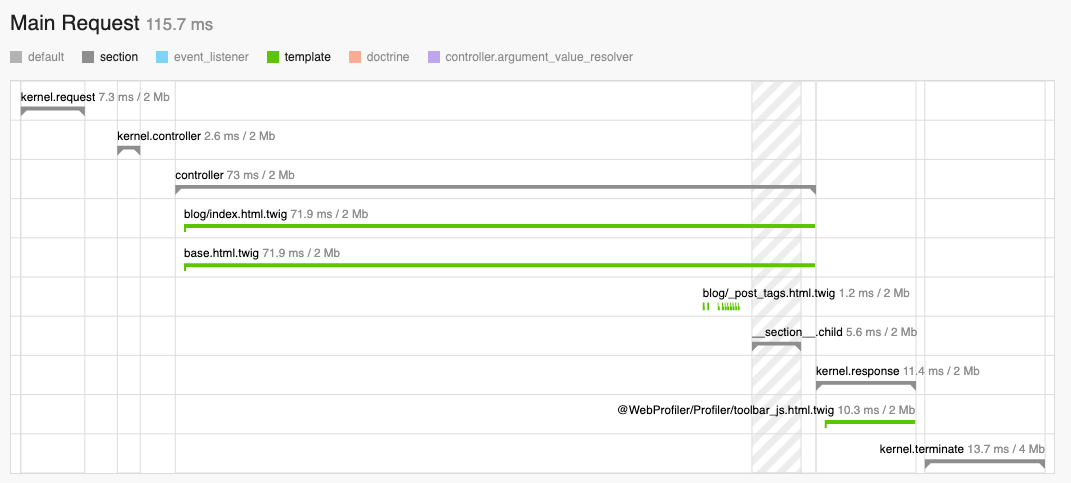
Symfony profiler
